How to access Analytics
Click on the Data & Reports tab on your dashboard, where you can see 'Order reporting' as well as 'Analytics data'. You'll see a range of different data points and reports available for you to download on your dashboard, we hope you find these helpful!

Please find key updates and features below.
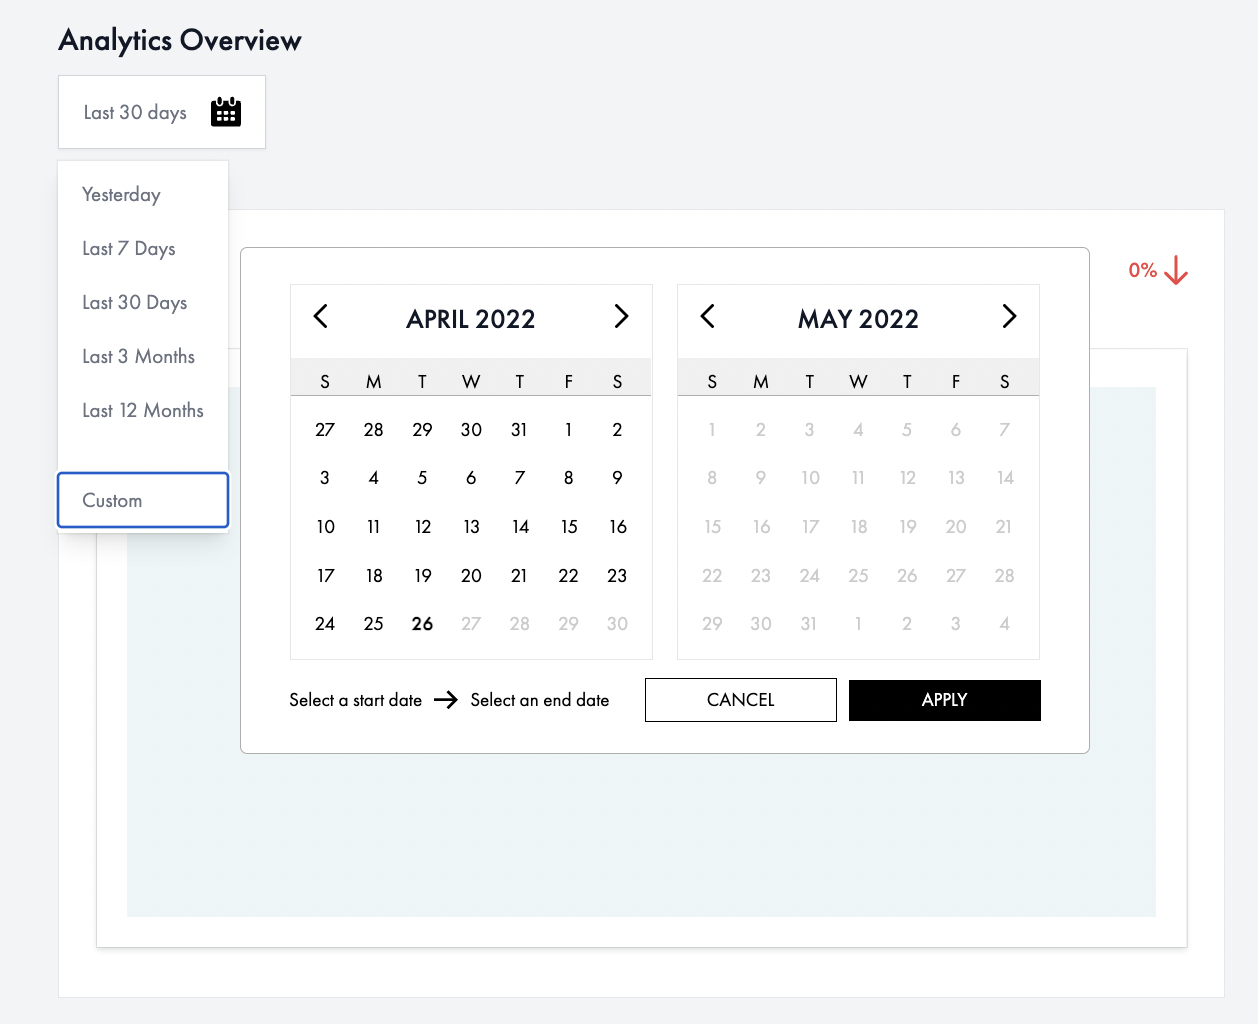
Selecting a time period 🕐
Select the calendar widget at the top of each page to choose a default timeframe or choose custom to select specific dates.
Hover oven the ? to find out more information regarding each report.
Order reporting 📊
Under the 'Order reporting' tab, you'll see a series of helpful options to access data relating to your orders.
Shipped Revenue

You can download each month's shipped revenue report via CSV. Each CSV file contains your sales data for the chosen month. Please note that it includes data based on shipped orders, and this includes store sales data, and it excludes returns.
Returned orders

Similarly to your shipped revenue report, you can also download a CSV of returned orders based on the original shipment date for the selected period.
Declined Orders

To see your declined order rate, you can click on the 'Declined Orders' tab where you'll be able to adjust the time period to see your declined order rate. You'll see a warning message if your declined order rate exceeds 1%.
You can download the report as a CSV, and see the product names and IDs, as well as the date they were declined in a list format if you scroll down.
Orders

You can access a graph or a list view of items ordered under the 'Orders' section of the dashboard. As always, you can select custom date ranges and download the CSV.
Store Sales

We've added a dedicated 'Store Sales' section of the order reporting for tracking store performance. If you are also in-store you can see how much you've sold in-store over a given time period in your dashboard. Location filtering and product search to come!
Analytics Data - Customer Insights
We've built out what customer insights you can review through the analytics of your products in order to best assess your brand's performance. For example, know what products have the most adds to customer's bags and wishlists can enable you to predict sales outcomes and improve the customer experience.
Conversion Rate 📈
You can now access detailed conversion rate data for your products, including adds to bag.
- Click on ‘Conversion Rate’ in the sidebar menu under ‘Analytics data’
- In the date picker dropdown, select the relevant timeframe
- The funnel at the top of the page will visualise the overall % of customer product page views that resulted in a product being added to a customer’s bag and then purchased, out of the total number of views (in the selected timeframe)
a. The funnel is split into 3 stages: Product page views vs Add to cart vs Successful checkout
5. Below the funnel there is a table that shows each unique item and it’s conversion rate (in the selected timeframe)
a. The table also shows Product page views vs Add to cart vs Successful checkout for each unique item
6. The table can be sorted by each column
a. By default the table is sorted by Product Name A-Z

Product Views

Similarly to the above Conversion Rate section, the functionalities are the same for your product views.
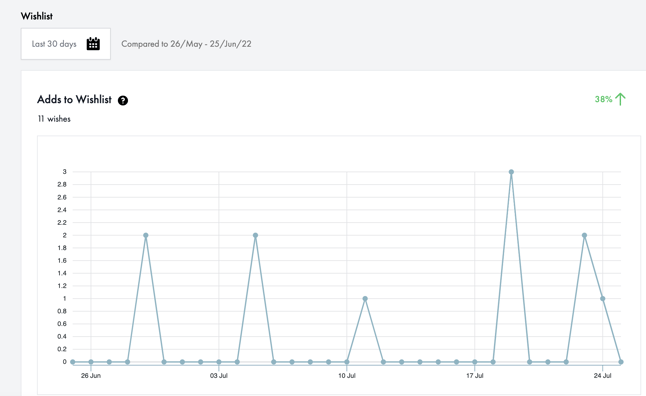
Wishlist
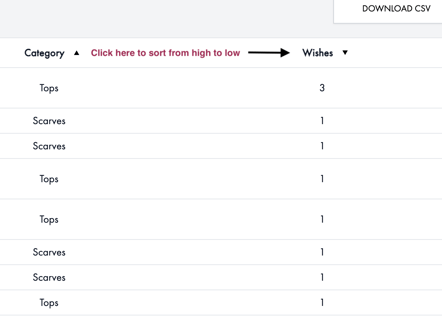
You will be able to see a detailed overview of what products are being added to the wish list. You can also filter by custom dates, search by specific products and download CSV files.
Clicking the arrow at the top of a column enables the table to be sorted by high to low (and vice versa) of that data point.
We want your feedback!

As always, we encourage brands to share any valuable feedback with the team. The best way to do this is by submitting the anonymous survey available on each page. We are always looking at ways to improve our new features so your feedback is appreciated!